Stock Market Basics
Understanding Gap Up and Gap Down in Stocks
Jan 24, 2026
Stock prices do not move gradually. Sometimes, they react instantly to new information, leading to sharp moves right at the market open. These movements often reflect how investors collectively respond to news released when markets are closed.
When you know what is a gap up and a gap down in stock market trading, it can help you interpret market sentiment, especially around news-driven events like earnings announcements or global developments. This article breaks down the concept in a practical way, without any jargon.
What Is a Gap in the Stock Market?
A gap occurs when there is a noticeable difference between a stock's closing price on one trading day and the price it opens on the next trading day, with no trading activity in between those prices.
This usually happens because stock markets are closed for several hours. During this time, you may get some new information about the stock, such as financial results, policy announcements, or global market movements. That can change how market participants value the stock. When markets reopen, prices adjust instantly. This adjustment is what creates a gap.
So, learning what is gap up and gap down in stock market behaviour begins with recognising that gaps reflect expectations, not just price movement.
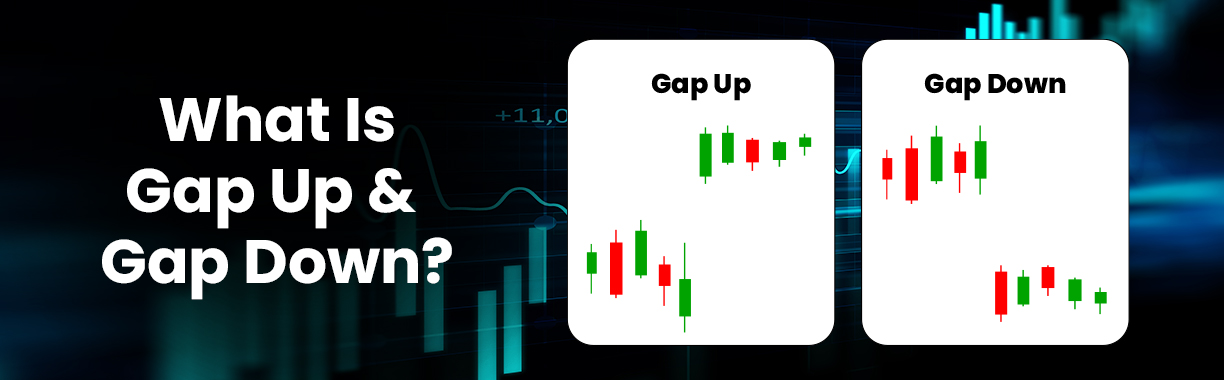
What Is a Gap Up?
A gap up happens when a stock opens at a price higher than the previous day's closing price.
Common reasons for a gap up include:
- Better-than-expected quarterly results
- Positive corporate announcements
- Strong global market cues
- Upgrades from analysts
Simple example:
If a stock closed at ₹100 and opens the next trading day at ₹108, it is said to have gapped up by ₹8. Such movements often suggest optimism among investors, at least at the opening of the trading session. This is one of the most common forms of gap up gap down stocks behaviour seen during earnings seasons.
What Is a Gap Down?
A gap down is the opposite situation. It occurs when a stock opens below its previous closing price.
Typical triggers for a gap down include:
- Weak earnings or guidance
- Regulatory issues
- Negative global news
- Broad market sell-offs
Simple example:
If a stock closed at ₹250 and opens the next trading day at ₹235, it is considered a gap down. Like gap-ups, gap-downs are closely watched because they provide early clues about market sentiment. This is another practical illustration of what is gap up and gap down in stock market dynamics in action.
Differences Between Gap Up and Gap Down
| Aspect | Gap Up | Gap Down |
|---|---|---|
| Opening price | Above previous close | Below previous close |
| Market sentiment | Generally positive | Generally cautious or negative |
| Common triggers | Earnings beats, positive news | Earnings misses, adverse news |
| Investor behaviour | Buying interest | Selling pressure |
This table helps simplify how investors often interpret gap up gap down stocks movements during market openings.
Types of Gaps You May Come Across
Not all gaps behave in the same way. Broadly, gaps are classified into the following categories:
- Common gaps: Often seen in sideways markets and may get filled quickly
- Breakaway gaps: Occur when prices move out of a trading range
- Runaway gaps: Appear during strong trends
- Exhaustion gaps: Can signal the end of a trend
Recognising the type of gap is important before drawing conclusions. This also plays a role in how to identify gap-up and gap-down situations more accurately.
How Traders and Investors Look at Gaps
Depending on the type of investors, one will view gaps differently:
- Short-term traders may look for momentum or quick reversals
- Long-term investors may use gaps as signals to reassess fundamentals
- Volume analysis is often used to confirm whether a gap is meaningful
It is worth noting that gaps alone do not guarantee future price direction. They are better used alongside broader market analysis rather than as a standalone gap-up and gap-down strategy.
Do Gaps Always Get Filled?
A common belief is that all gaps get filled, meaning prices eventually return to the previous level. While this does happen in some cases, it is not a rule.
Some gaps remain unfilled for long periods, especially when they are supported by strong fundamentals or sustained trends. This is why understanding what is gap up and gap down in stock market behaviour requires context rather than assumptions.
Risks of Trading Based Only on Gaps
Before acting on gap movements, it is important to be aware of the risks:
- False signals in volatile markets
- Sharp reversals after market open
- Low liquidity in some stocks
- Overreaction to short-term news
Gaps should be treated as indicators, not instructions. Disciplined analysis matters more than speed.
Conclusion
Understanding what is gap up and gap down in stock market movements can add an extra layer of insight into how markets react to information. Gaps often reflect changing expectations, but they do not paint the complete picture of how it will perform. For retail investors, the key lies in observing gaps calmly, understanding their causes, and combining them with volume trends, company fundamentals, and broader market direction.
You can explore educational tools and market insights that support you to make informed decisions. You can consider learning resources provided by Indiabulls Securities Limited (formerly Dhani Stocks Limited).
FAQs
1. Are gap movements common in certain stocks?
Yes, gaps are frequently seen in actively traded stocks and during earnings seasons.
2. Can long-term investors ignore gaps completely?
Not always. While long-term investors may not trade gaps, they can still signal changes in market perception.
3. Are gaps only relevant for day traders?
No. Gaps can also help investors understand sentiment shifts and reassess risk.
4. Do global markets influence gap formation?
Yes. Overseas market movements often influence opening prices, especially in globally linked stocks.
Disclaimer: The contents herein are only for information and do not amount to an offer, invitation or solicitation to buy or sell securities or any other financial product offered by Indiabulls Securities Limited (formerly Dhani Stocks Limited / DSL). The content mentioned herein is subject to updation, completion, amendment without notice and is not intended for distribution to, or use by, any person in any jurisdiction where such distribution or use would be contrary to law or would subject Indiabulls Securities Ltd. (formerly Dhani Stocks Ltd. / DSL) to any licensing or registration requirements. No content mentioned herein is intended to constitute any investment advice or opinion. ISL disclaims any liability with respect to accuracy of information or any error or omission or any loss or damage incurred by anyone in reliance on the contents herein. This blog is based on information obtained from public sources and sources believed to be reliable, but no independent verification has been made about its accuracy or its completeness is guaranteed. This content mentioned in this blog is solely for informational purpose and shall not be used and/or considered as an offer or invitation or solicitation to buy or sell securities or other financial instruments. ISL will not treat recipients as customers by virtue of their receiving this report. The securities / Mutual Fund units (if any) discussed and opinions expressed in this blog/report may not be suitable for all investors. Such investors must make their own investment decisions, based on their investment objectives, financial positions and specific needs. ISL accepts no liabilities whatsoever for any loss or damage of any kind arising out of the use of this report. Past performance is not necessarily a guide to future performance. Investors are advised to see Risk Disclosure Document to understand the risks associated before investing in the securities markets. ISL may have issued other blogs that are inconsistent with and reach different conclusion from the information presented in this blog.
Indiabulls Securities Limited (formerly Dhani Stocks Limited) is a Mutual Fund Distributor registered with ‘Association of Mutual Fund of India’ (AMFI) vide ARN number ARN-160411. Corporate Identification Number: U74999DL2003PLC122874; Registered office address: A-2, First Floor, Kirti Nagar, New Delhi - 110008. Tel.: 011-41052775, Fax: 011-42137986.; Correspondence office address: Plot no. 108, 5th Floor, IT Park, Udyog Vihar, Phase - I, Gurugram - 122016, Haryana. Tel: 022-61446300. Email: helpdesk@indiabulls.com